


 – Scott Tominaga")
When surveying a sizable population of respondents, the term “sample size,” which is widely used in statistics and market research, always comes up. It has to do with the extensive study of populations in research.
Thus the sample size involves determining the number of observations or replicatingthe repetition of an experimental condition used to determine the variability of phenomena that should be included in a statistical sample. Therefore making conclusions about a population based on a model is crucial to every empirical investigation.
Factors To Consider When Calculating Sample Size
Population Size
The size of the whole population you wish to examine should be another essential factor to consider when choosing your sample size. The entire group you want to judge is referred to as a population.
Using probability or non-probability samples, a sample is selected from the population. There is a need for a close estimate, mainly when working with relatively small or straightforward groups of people.
The population size may be known such as the total number of employees in a corporation or unknown such as the number of pet owners in a country.
Determine Confidence Interval (Margin of Error)
Confidence intervals quantify how sure or unsure a sampling technique is and how uncertain each given statistic is. Simply put, the confidence interval indicates how certain you may be that a study’s findings correspond to what you anticipate finding if it were possible to poll the total population under consideration. The confidence interval is often expressed as a plus or minus number.
If, for instance, your confidence interval is 6 and 60% of your sample selects an answer, you can be confident that, if you had polled the entire population, between 54% (60-6) and 66% (60+6) would have chosen that response.
Set your Confidence Level
When you draw a random sample numerous times, the confidence level is the likelihood or degree of certainty that the confidence interval will include the actual population parameter.
It is given as a percentage and indicates the frequency with which the confidence interval encompasses the portion of the population that would choose a particular response.
A confidence level of 99 percent, for instance, indicates that your results will, 97% of the time, match those of a population if you repeat an experiment or survey repeatedly.
You can be more confident that the larger your sample size, the more the respondents’ responses accurately reflect the population. Your confidence interval will be lower if your sample is more significant for a particular degree of confidence.
Specify the Standard Deviation
The standard deviation, which gauges a data set’s distribution from its mean, is crucial for determining the sample size. When choosing sample size, the standard deviation helps estimate how many replies you receive,and the mean number will differ.
Additionally, the standard deviation of a sample can be used to approximate the standard deviation of a population: the standard deviation and magnitude increase in proportion to the degree of distribution or variability.
For instance, how much variation do you anticipate in your survey responses once it has already been distributed? The standard deviation measures how responses varied.
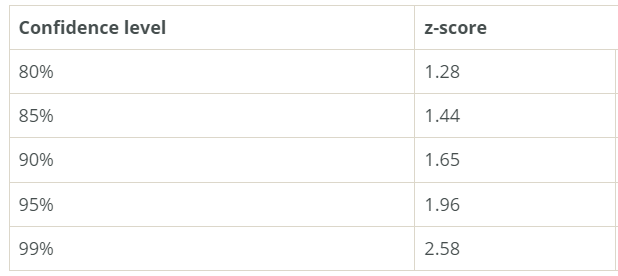
Convert the Confidence Level into A Z-Score
The table below indicates the z-scores for the confidence levels.
Put the Figures into the Sample Size Formula to get your Sample Size.

Summing Up Sample Size
Calculating sample size may seem difficult, but there are now calculators and simple sample size formulas that can speed up this time-consuming research phase.


![Anso FG Reviews UPDATED 2024 [ansofg.com]](/wp-content/uploads/2023/12/Anso-FG-Reviews-UPDATED-2024-ansofg.com_-100x70.png "Anso FG Reviews: UPDATED 2024 [ansofg.com]")


